Worker Migration Across State Lines: 2011-2015
Summary:
From 2011 through 2015, approximately 2.8% of workers moved from one state to another. Compared to the workforce as a whole, workers that move tend to be younger, modestly better educated, and underpaid relative to the typical income of workers of similar age, education, occupation, sex and race.
The primary drivers of net worker migration across state lines are: 1) state employment growth, 2) state tax burdens, and 3) the percentage increase in salary they might expect. For the wealthiest 5% of workers who move, only state employment growth is correlated with their net migration.
States that are losing workers are probably also losing worker incomes on a net basis. The loss of income can be material relative to the difference between state revenues and expenses.
Migrating Worker Characteristics
This discussion is based on analyzing data from the Government’s Census data made available by the University of Minnesota through IPUMS-USA.[1] The subset of data I used was all persons who had wage income (INCWAGE>0) and did not have retirement income (INCRETIR) or Social Security Income (INCSS) in years 2011 through 2015. I excluded retirees as their motivations for moving are quite distinct from non-retirees. I only looked at state to state moves (I did not look at people moving to a state from another country).
Workers who moved across state lines in this period had a median age of 28 years, significantly younger than the 41 year median age of all workers. Younger workers are presumably more mobile because they are less likely to be married and/or have children.[2]
Table 1 shows that migrating workers also were somewhat more educated on average than the workforce as a whole.
Table 1: Educational Composition of Workers Who Moved Across State Lines vs. All Workers

On average, migrating workers incomes were only 91% of what they would have been expected to make based on their age, education, occupation, sex and race.
In summary, the composite profile that emerges from the data of workers who move is that they are young, mobile, relatively educated, and motivated to eliminate an income deficit relative to what they should earn based on their credentials.

What Determines Where Workers Move?
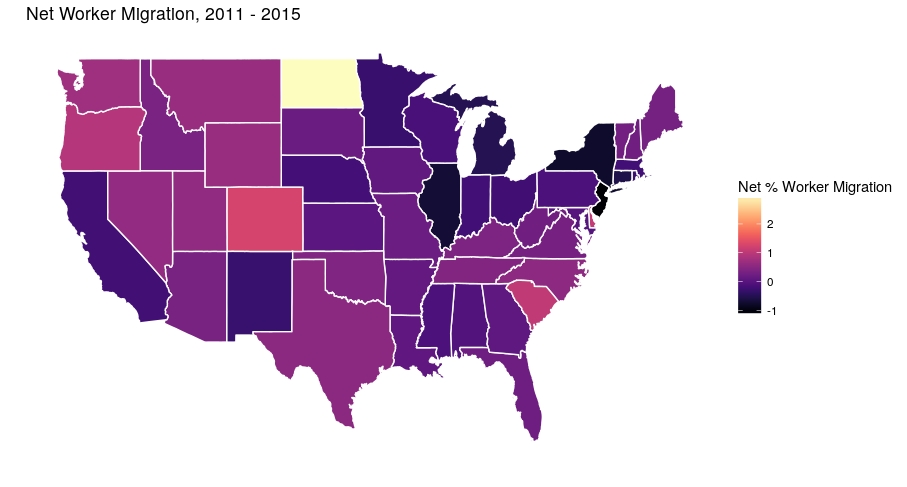
Net worker migration is defined as workers moving in minus workers moving out divided by total workers in the state. Table 2 shows key characteristics of the seven states who received the most net workers from other states, and the seven states who lost the most net workers.
Table 2: Top 7, Bottom 7 States By Net Worker Migration During 2011 - 2015
| State | Net Worker Migration % | State Income, Sales, Prop. Tax | Cum. Employment Growth | Net Worker Dollars $MM | % Net Dollars/State Rev - Exp | Avg Inc All Workers | Avg Income Incoming Workers |
| North Dakota | 3.0 | 9.00% | 21.10% | $331 | 11% | $43,693 | $27,742 |
| Colorado | 1.2 | 8.90% | 16.20% | $1,810 | 133% | $47,875 | $38,954 |
| Delaware | 1.1 | 10.20% | 10.70% | $72 | 39% | $45,068 | $35,004 |
| South Carolina | 1.0 | 8.40% | 13.70% | $594 | 40% | $37,575 | $32,764 |
| Oregon | 0.9 | 10.30% | 14.00% | $702 | 59% | $41,804 | $33,397 |
| Washington | 0.7 | 9.30% | 13.20% | $1,806 | 103% | $49,246 | $41,703 |
| Wyoming | 0.6 | 7.10% | 3.60% | -$21 | -1% | $42,758 | $29,076 |
| New Mexico | -0.3 | 8.70% | 3.00% | -$244 | -24% | $37,724 | $33,557 |
| Michigan | -0.5 | 9.40% | 12.00% | -$1,033 | -170% | $41,307 | $33,688 |
| Connecticut | -0.6 | 12.60% | 4.00% | $91 | 5% | $58,697 | $50,544 |
| Illinois | -0.7 | 11.00% | 7.30% | -$1,944 | -374% | $48,002 | $39,034 |
| New York | -0.8 | 12.70% | 9.50% | -$3,657 | -121% | $52,958 | $45,197 |
| New Jersey | -1.1 | 12.20% | 4.90% | -$1,854 | -52% | $58,336 | $52,979 |
| Alaska | -6.4 | 6.50% | 4.50% | -$1,126 | -18% | $48,583 | $34,167 |
The three factors I found in the Census data for this period that are correlated to which states workers choose to migrate to are: 1) state employment growth, 2) state tax burden and 3) the ratio of a state’s average worker income to the average incoming workers’ income.[3]
When a state has strong employment growth, the new jobs can be filled by workers already living in that state (with a commensurate decline in the state’s unemployment rate). However the data indicates that strong employment growth also attracts workers from out of state.
Figure 1 shows the relationship between state employment growth and net worker migration.[4] Employment growth explains about 30% of the variation in net worker migration.
Figure 1: Net Worker Migration vs. State Employment Growth %

Figure 2 shows that workers seem to prefer moving to states with low personal tax burdens (personal income, sales and property tax). State tax burden explains about 20% of net worker migration over this period.
Figure 2: Net Worker Migration vs. State Tax Burden

It might be tempting to conclude that state employment growth is naturally stronger in states with low personal tax burdens (i.e., that these two factors are correlated). However, Figure 3 shows that is not the case. While the relationship runs in the direction expected (higher taxes are correlated with lower employment growth), the relationship is not statistically significant and only explains 2.8% of the variation in state employment growth. However state tax burdens do appear to influence workers’ choices regarding where they choose to move.
Figure 3: State Employment Growth vs. State Tax Burden

There is a weak, but statistically significant relationship between net worker migration and the ratio of average worker income by state relative to the average income of workers who move to that state. Workers appear to favor states that have high average incomes relative to their own. Figure 4 shows that relationship which explains about 7% of net worker migration.
Figure 4: Net Worker Migration vs. Ratio of Avg. State Worker Income to Incoming Worker Income

The income ratio factor continues to be statistically significant when combined in one predictive model that also includes state employment growth and state tax burden. All three factors combined explain 53% of the variation in net worker migration. The relationship between predicted net worker migration and actual worker migration is shown in Figure 5.
Figure 5: Net Worker Migration vs. Predicted

If one looks at the wealthiest 5% of workers (total annual income > $125,000/person), state employment growth is the only factor correlated with their net migration across state lines. State employment growth explains 22% of their net migration. Presumably at their income level, their specific income opportunity makes them indifferent to tax considerations or a state's average worker income.

The Economic Impact Of Worker Migration
The net income gains or losses from worker migrations can be material relative to state operating net income. We can crudely estimate the income gained or lost by summing the total income of incoming workers minus the income of outgoing workers.
Table 2 above includes a column showing net income gain/lost per year and another showing net income gain/lost scaled as a percentage of the state's revenues minus expenses. The net of workers moving from Illinois, for example, had income of $1.9 billion/year (4th column of Table 2).[5] That amount is significant relative to Illinois state's revenues minus expenses of -$520 MM in 2014.
It is difficult to quantify the exact impact on Illinois state finances for several reasons. First of all, the job vacated by a migrating worker may be filled by another worker who resides in the state (thus the income is not truly "lost"). Also, only a portion of the lost worker income would have been remitted in state taxes. However, a significant portion of any income that is truly lost would also have been spent in Illinois, generating additional sales and income tax revenue from local businesses.
Directly correlating state revenues with net migration is difficult because revenues are also influenced by changing tax rates, volatile capital gains, changes in economic activity and changes in the unemployment rate. Figure 5 does seem to corroborate the Census data which indicates that Illinois has experienced a downturn in collected personal income taxes (similar in magnitude to that experienced in the 2008 "Great Recession") along with declines in its resident population.
Figure 5: Illinois Income Tax Collection And Resident Population

While it is difficult to accurately measure the effect of net worker migration on state revenues, losing workers on a net basis cannot be helpful. Over time the cumulative impact of net worker income gained or lost can be meaningful as a headwind or as a tailwind for states as they work to balance their budgets. Unfortunately the states that are losing workers due to high tax burdens also tend to have higher levels of unfunded pension debt. It is difficult to quantify the exact impact on Illinois state finances for several reasons. First of all, the job vacated by a migrating worker may be filled by another worker who resides in the state (thus the income is not truly "lost"). Also, only a portion of the lost worker income would have been remitted in state taxes. However, a significant portion of any income that is truly lost would also have been spent in Illinois, generating additional sales and income tax revenue from local businesses.
Directly correlating state revenues with net migration is difficult because revenues are also influenced by changing tax rates, volatile capital gains, changes in economic activity and changes in the unemployment rate. Figure 5 does seem to corroborate the Census data which indicates that Illinois has experienced a downturn in collected personal income taxes (similar in magnitude to that experienced in the 2008 "Great Recession") along with declines in its resident population.
Figure 5: Illinois Income Tax Collection And Resident Population

Figure 6: The Relationship Between State Tax Burden And Their Unfunded Pension Liability

States that are losing workers can attempt to reverse these trends by encouraging job growth within their state and, if fiscally possible, lowering their personal tax burdens.
Transparent and reproducible: All of the labeled Figures and Tables can be generated either from links in the essay or by using the free, publicly-available R program and the R code available in “WorkerMigration.r” on github to analyze the publicly available data referenced by links in the article.
[1] IPUMS-USA, University of Minnesota, www.ipums.org. The data is provided freely but is subject to their licensing restrictions.
[2] This is a hypothesis; I did not look at the data to verify it.
[3] Factors that don’t drive worker migration, but do drive retiree migration, include a state’s cost of living and average winter temperature.[2] This is a hypothesis; I did not look at the data to verify it.
[4] Alaska is omitted from the data used to estimate relationships affecting net worker migration as Alaska has unique income characteristics.
[5] IRS Migration data indicates much larger "income" losses. For Illinois, for example, the IRS data indicates the income of workers who moved from Illinois was $3.4 Billion/Year greater than the income of workers who moved to Illinois for the years 2011 - 2014. The IRS data includes retirees that are not included in Table 2. Also, the IRS data excludes those who are not required to file a tax return (e.g., the poor and the elderly). In general, however, the IRS data confirms the Census data regarding the overall trends and specific states which are losing residents.


Comments